Dashboards
TrackVision includes a comprehensive analytics and dashboarding capability built directly into the platform. All your traceability, operational, and engagement data is available for analysis in real time — no separate data warehouse, no ETL delays.
Analytics in TrackVision has two tiers:
- Insights — curated dashboards for business users, accessible to anyone with appropriate permissions
- Advanced Analytics — self-service dashboard creation and SQL querying via Apache Superset, for advanced users and implementation partners
Insights
Click the Insights button in the far left navigation menu to open the dashboard list.
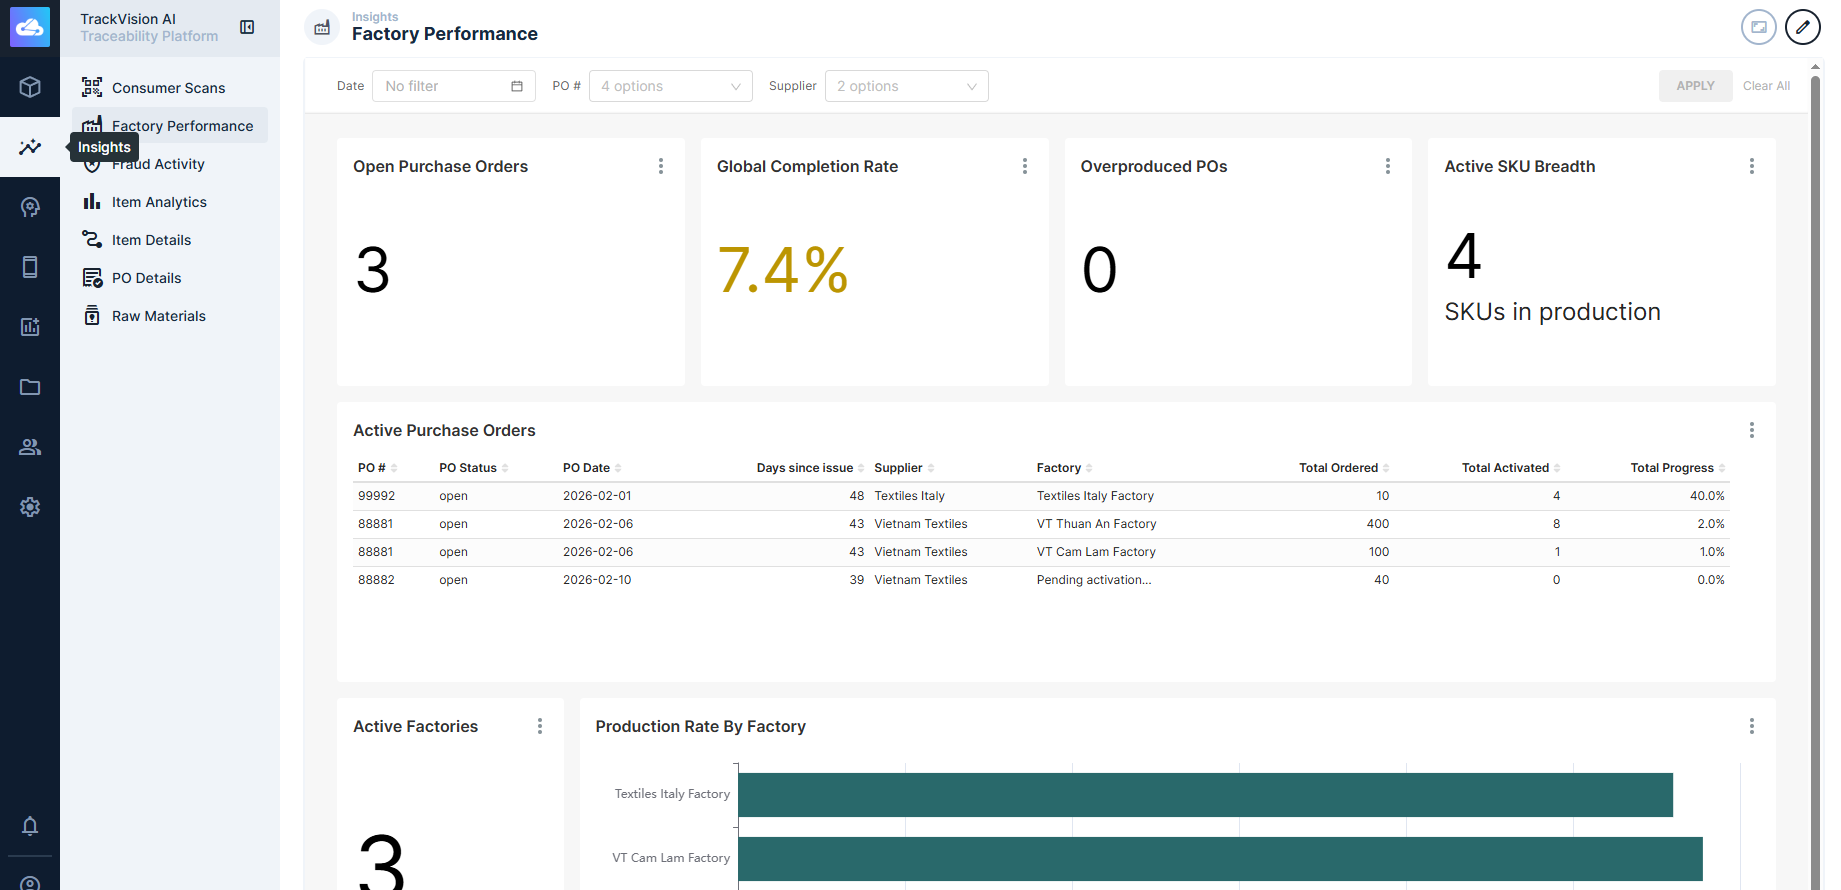
TrackVision ships with a set of pre-built dashboards covering common supply chain metrics — scan activity, lot traceability, event volumes, inventory state, and more. During onboarding, TrackVision staff will work with you to understand your specific use cases and supply chain goals, and prepare additional dashboards tailored to your organisation.
Dashboards support interactive filtering — most dashboards allow you to narrow the view by date range, product, location, or other dimensions without leaving the page.
Advanced Analytics
Click the Advanced Analytics button in the far left navigation menu to open the Apache Superset environment.
Advanced Analytics is intended for users who need to go beyond the curated dashboards — building custom visualisations, defining new datasets, or running ad-hoc SQL queries against the full TrackVision data model.
What is Apache Superset?
Apache Superset is a widely-used open-source business intelligence platform. TrackVision embeds it directly, with your TrackVision login and permissions carrying through — you don't need a separate account.
Superset provides:
-
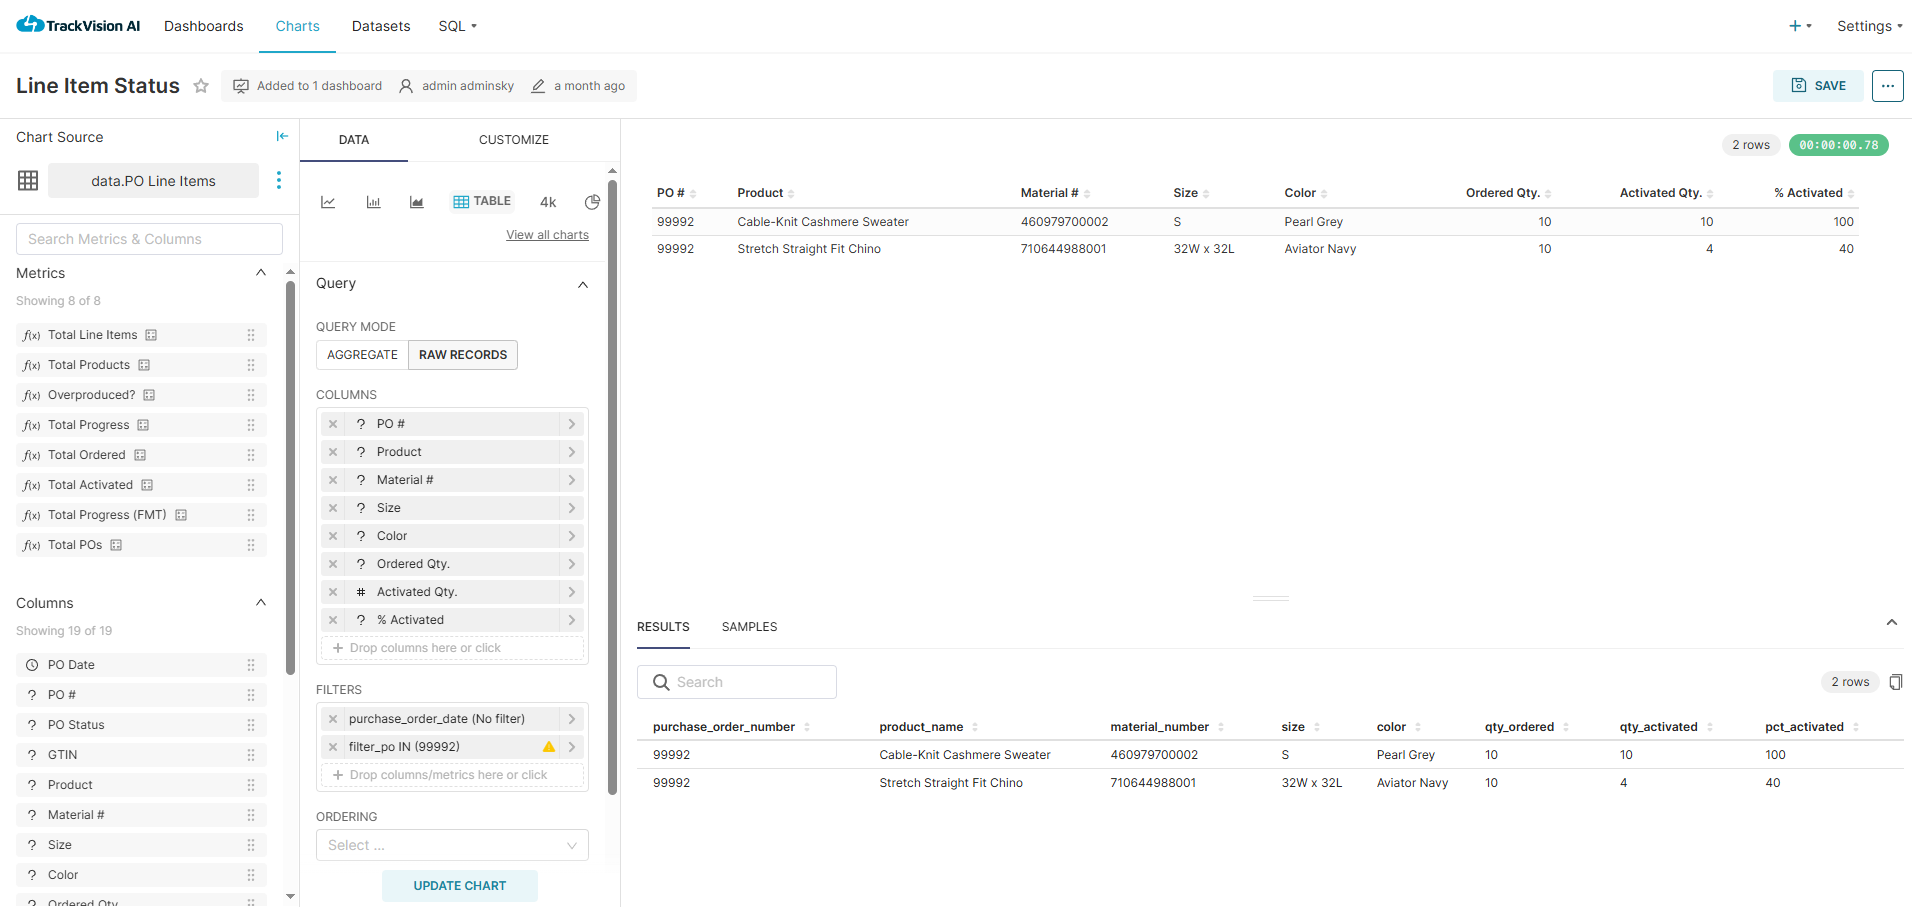
Chart Builder — create visualisations from pre-configured datasets or your own SQL. Supports time series, maps, bar/line/pie, scorecards, sankey diagrams, pivot tables, and more. Charts are saved and can be added to any dashboard.
-
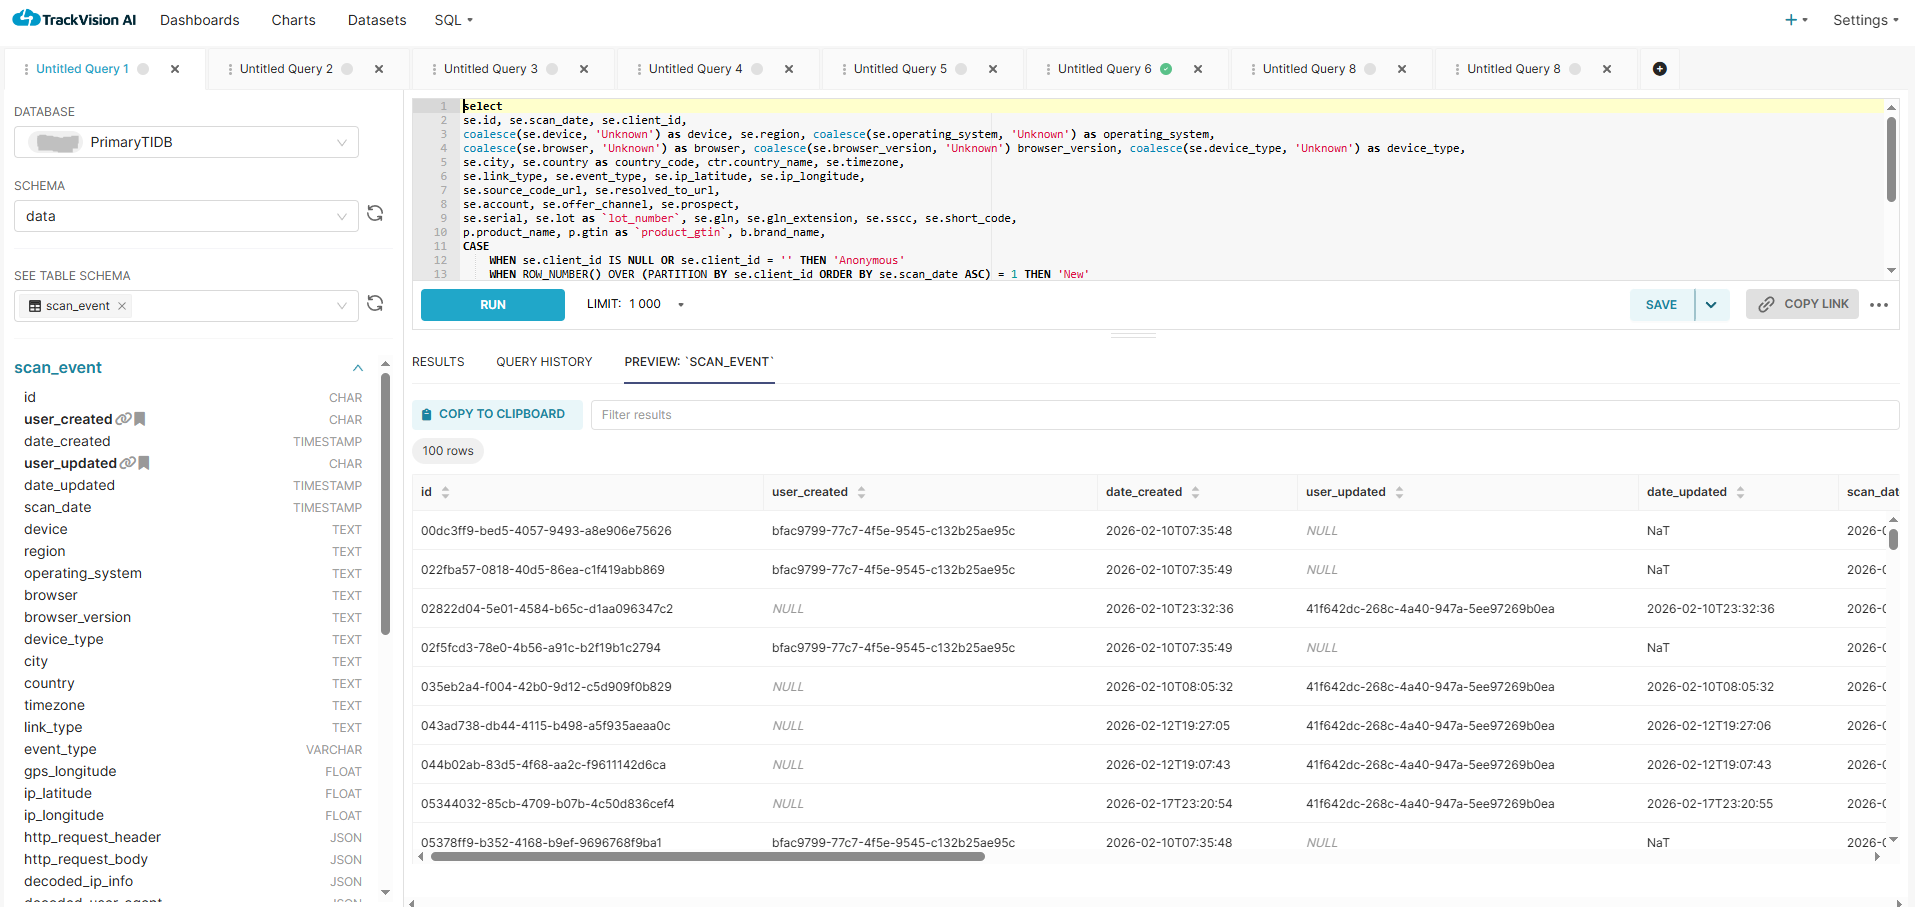
SQL Editor — write arbitrary SQL directly against your TrackVision data. Useful for ad-hoc investigation: tracing a specific lot through the supply chain, checking scan event counts by location over a date range, or exploring data before turning it into a chart.
-
Dashboard Builder — compose charts into interactive dashboards, add filters, and share with other users. Dashboards built here can be surfaced in the main Insights view once reviewed.
-
Row and column-level security — restrict what data different users or roles can see within a dataset, without needing separate datasets per audience.
Because Superset is a mature platform with its own extensive documentation, this documentation focuses on TrackVision-specific datasets and configuration. For general Superset usage — chart types, SQL editor features, dashboard layout, alerts and reports — refer to the Apache Superset documentation.
Data Available for Analysis
All data stored in TrackVision is queryable. Pre-configured datasets cover the most common query patterns. This includes:
- EPCIS event data — all supply chain events (commissioning, packing, shipping, receiving, transformation, decommissioning) with their associated EPCs, locations, timestamps, and business steps
- Serialised item state — the continuously-calculated current state of every serialised item (location, custody, packing hierarchy, status)
- Master data — product types (GTINs), locations (GLNs), organisations, and their relationships
- Scan/read events — consumer QR code scans and B2B reader events, including geolocation where available
- Sensor data — temperature, humidity, and other telemetry associated with supply chain events
- Certification and content data — structured records and documents attached to products or batches
You can also define your own virtual datasets (saved SQL views) in Advanced Analytics for repeated use.
Common Analytics Patterns
Lot traceability investigation — given a recalled ingredient or supplier, find every finished goods lot that contains it, where those lots are currently located, and what consumer or B2B scans have occurred against them.
Scan analytics — analyse consumer engagement with QR codes by geography, time, product, and campaign. Identify duplicate scan anomalies that may indicate code cloning or diversion.
Compliance reporting — generate evidence of chain of custody for regulatory requirements (DSCSA, FSMA 204, EU DPP), including complete event histories for specific serialised items or lots.
Operational throughput — track event volumes by location, line, and shift. Useful for understanding scanning compliance rates and identifying gaps in event capture.
Cold chain monitoring — correlate temperature excursion events with lot-level movement data to determine which products were affected and at what point in the chain.
Access and Permissions
Access to both Insights and Advanced Analytics is controlled through TrackVision's standard role system. Roles can be configured to:
- Restrict which datasets a user can query or view
- Limit visible rows within a dataset (e.g. restricting a site manager to events at their facility)
- Grant or deny access to the SQL editor and dashboard builder
Reach out to your TrackVision administrator to configure analytics access for your organisation.
Related Documentation
- Analytics Architecture — how TrackVision's HTAP database infrastructure powers real-time analytics at scale